
pyvoa (Python Virus Open Analysis) is an open-source Python library giving unified access to epidemiological databases, a standardised data format, transparent joins with geolocation data, and built-in time-series and cartographic visualisation.
It is meant to be usable by non-specialists — high-school and university students, science journalists, researchers unfamiliar with data extraction — while remaining scriptable for advanced Python users.
Install with pip install pyvoa, or pip install pyvoa-full for every
visualisation backend.
Comparing countries
import pyvoa.front as pf
pf.setwhom('owid')            # Our World in Data, worldwide, by country
pf.setvis('matplotlib')
pf.plot(which='total_deaths', where='Western Europe',
        what='daily', option='smooth7')
where='Western Europe' expands to the nine states of the United Nations
geoscheme subregion — Switzerland, Liechtenstein and Monaco among them, so the
grouping is not the European Union and does not have to be. what='daily'
differentiates the cumulative series the source publishes, and
option='smooth7' applies a weekly rolling mean, which removes the
reporting-day artefact visible in every national series.
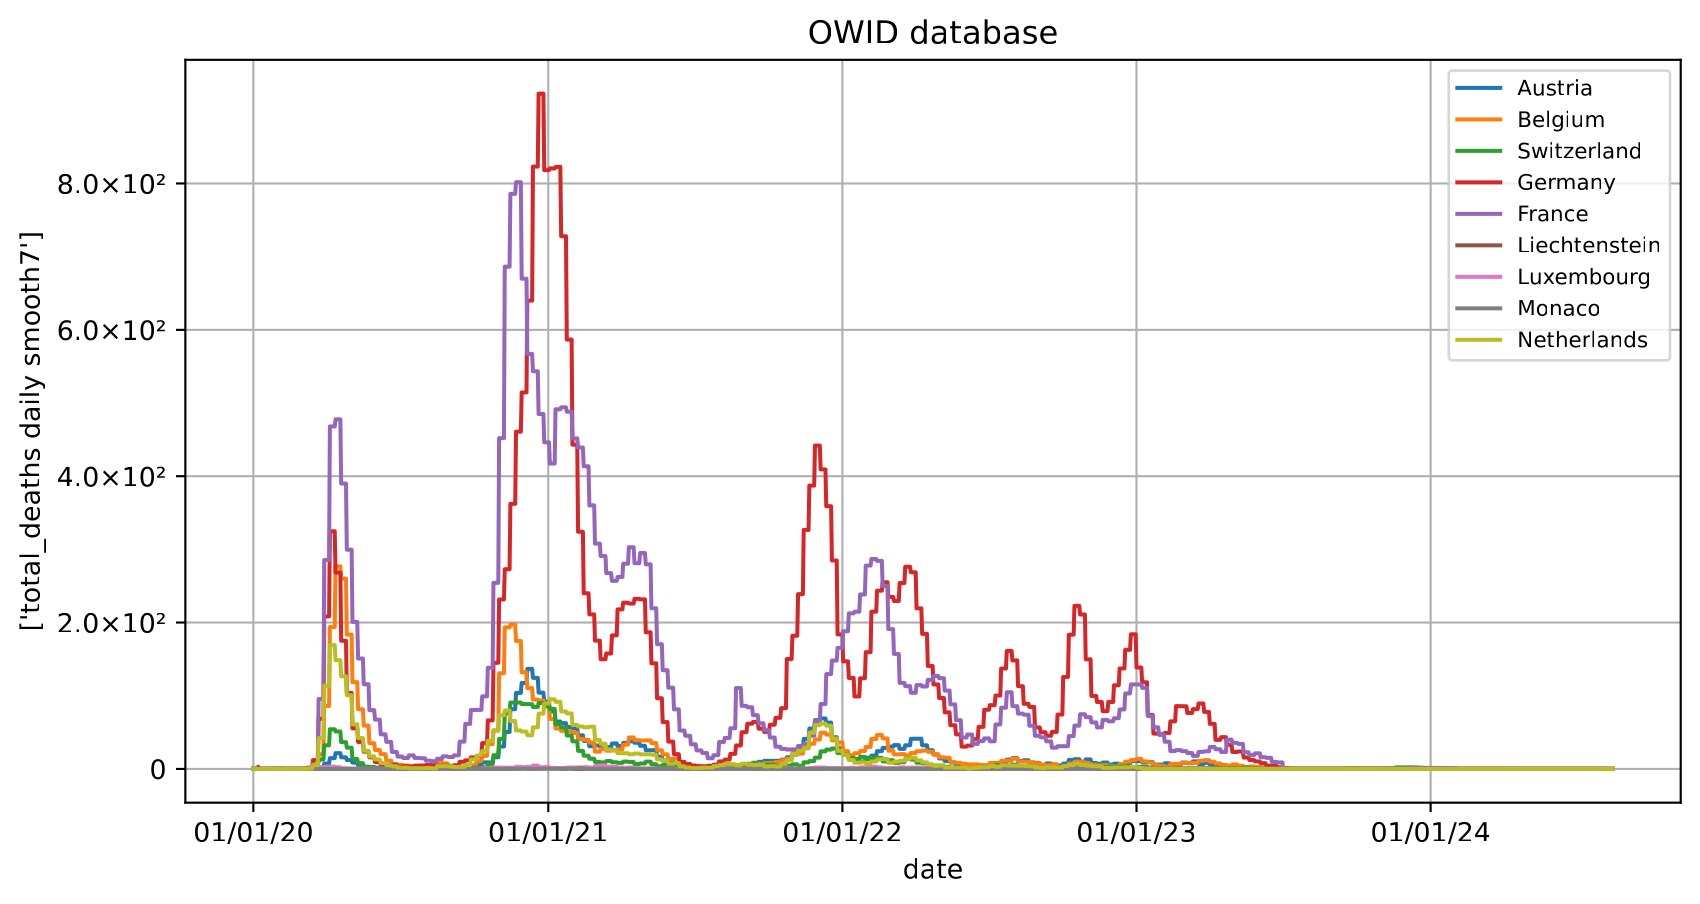
What those five lines draw. Selecting the database, resolving the country names and joining the geography are all done for you.
Mapping a grouping
pf.setwhom('jhu')             # Johns Hopkins CSSE, worldwide
pf.map(which='tot_confirmed', where='G20', when='31/12/2021')
One keyword selects the G20 member states and the geolocation layer supplies
their geometries; countries outside the grouping are left unpainted. Without
what, a tot_ variable is mapped at its cumulative value.
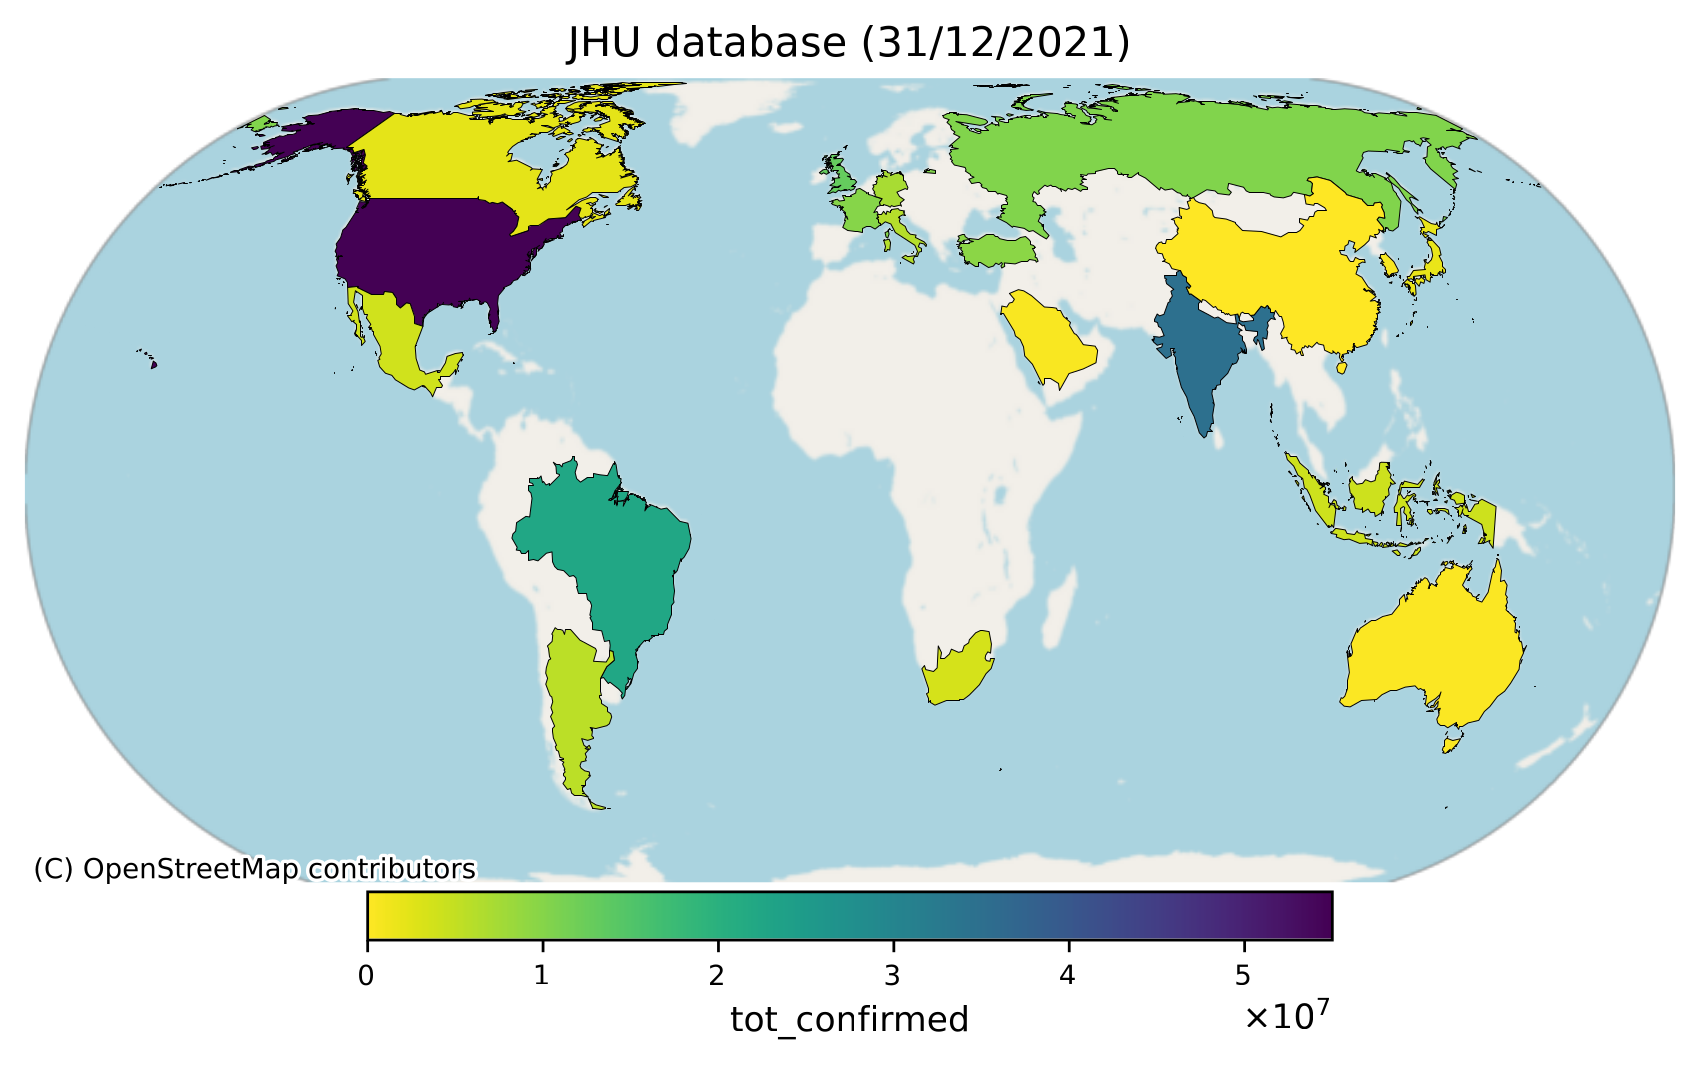
Three keywords, drawn geographically instead of against time.
Both listings are the first two examples of the software paper, and are run verbatim by
examples/pyfiles/paper_examples.py, which writes the figures above.
How it fits together
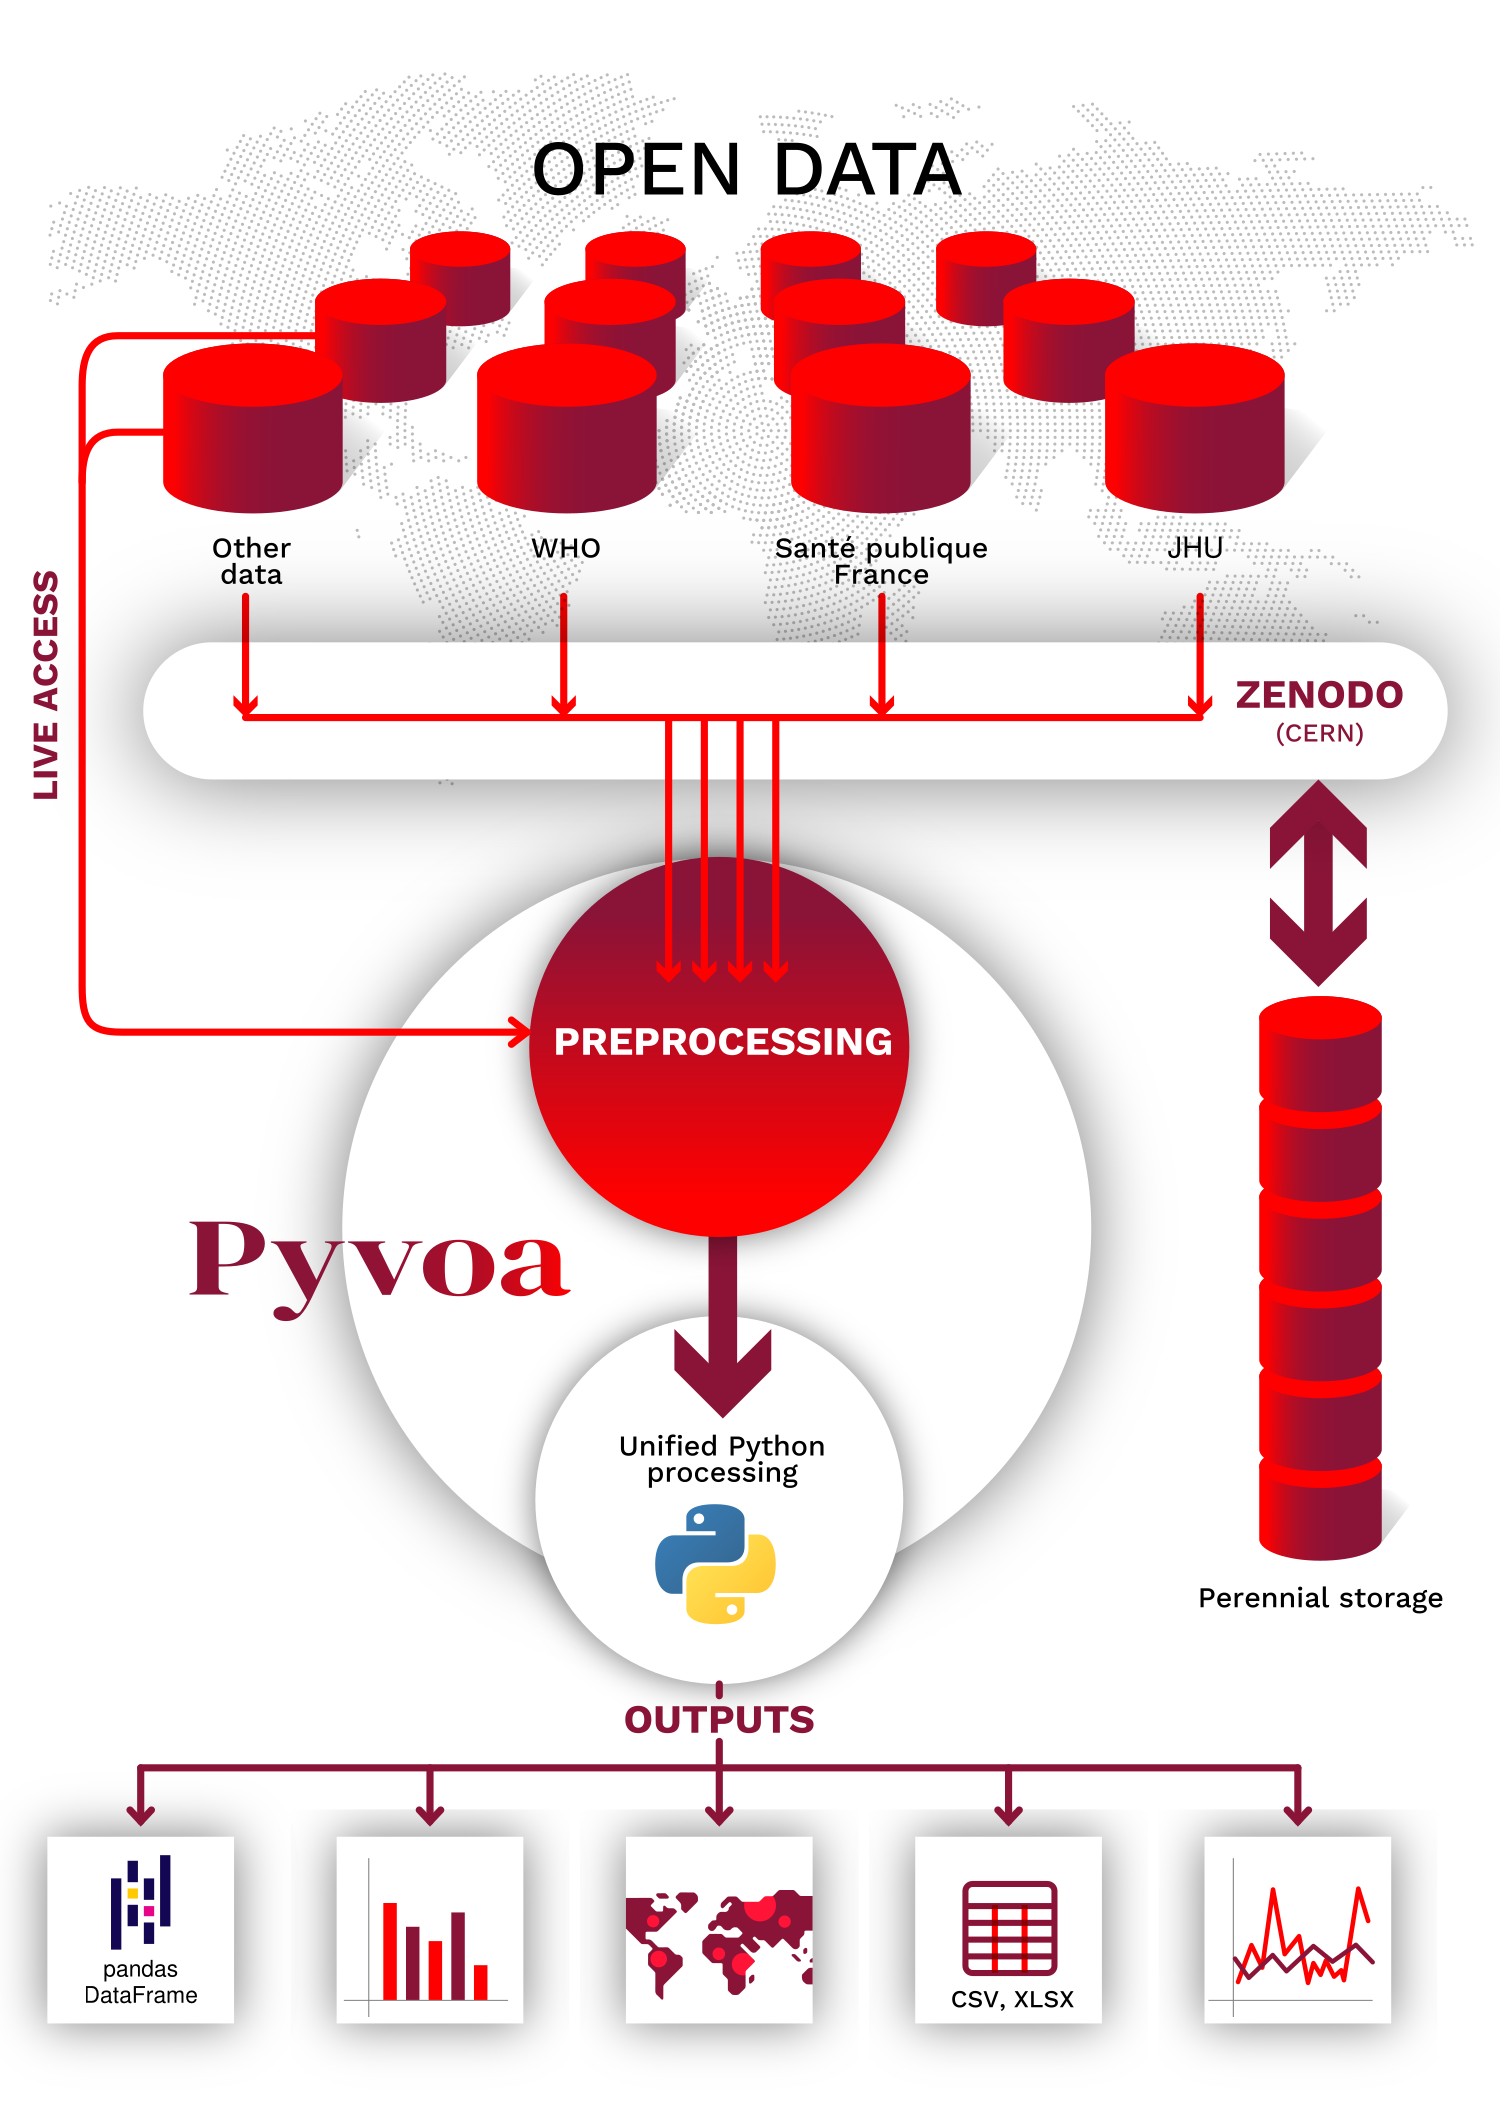
Each database is described by a JSON file rather than by code, so the catalogue grows without the library changing. The sources are mirrored on Zenodo, which is what makes a given release reproducible, and can also be read live from their providers; the geolocation layer reconciles the location identifiers; and the result is one pandas DataFrame that any of the backends can draw.
Links
Project site: https://pyvoa.org
Source: https://github.com/pyvoa/pyvoa
Package: https://pypi.org/project/pyvoa/